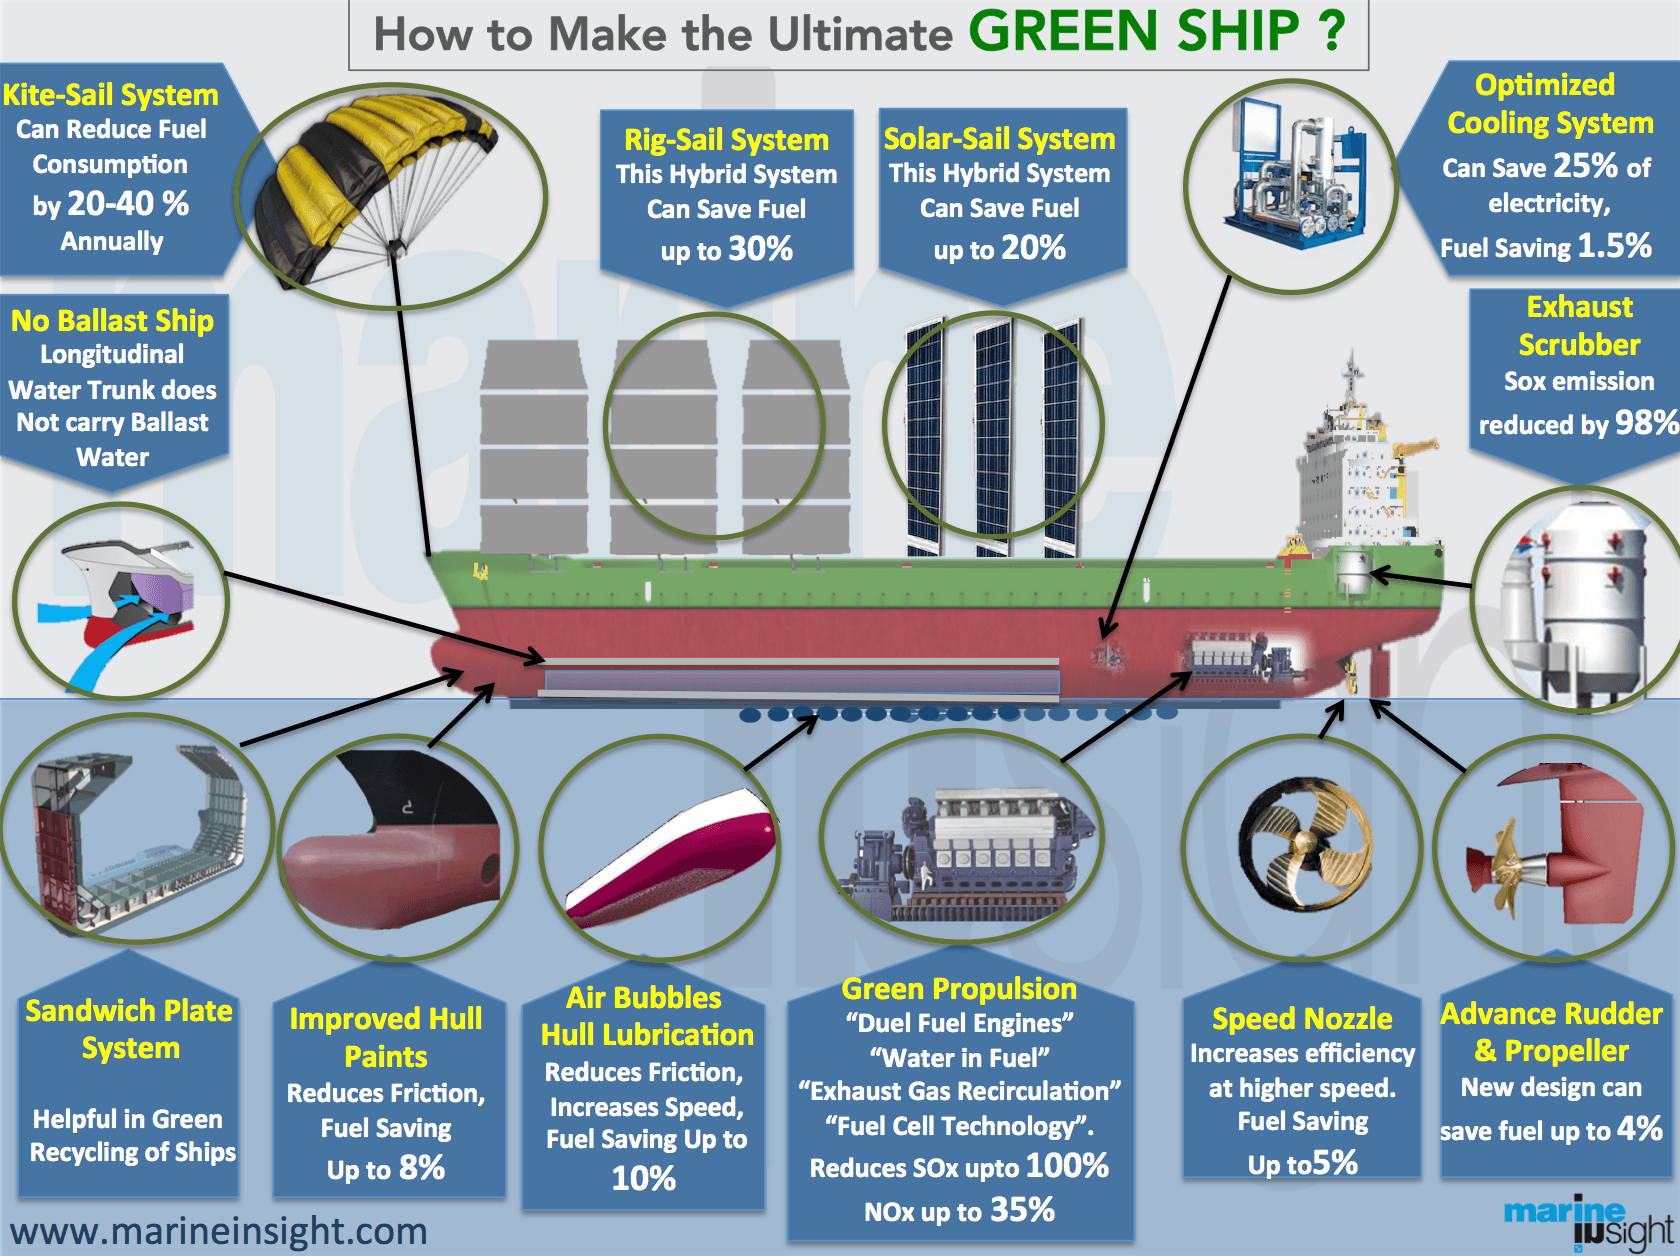
Infographics: Technologies To Make An Ultimate Eco-Friendly Ship
With the introduction of stringent environmental regulations in the maritime industry, almost all modern ships are now fitted with a variety of eco-friendly machinery and systems. These green technologies not only reduce the carbon footprints but also help in saving fuel and increasing efficiency of ships.
This infographics explains all the famous green technologies that have been implemented on ships or are under active development.
Technologies mentioned in the infographics for an eco-friendy ship:
1. Kite Sail System / Skysails
2. Solar / Wind Sails
3. Air Bubbles / Air Lubrication System, Carpet of bubbles
6. Sox/ Nox Reducing Technologies
7. Hull Protection
This is not an exhaustive list of green technologies introduced in the maritime market but all the important ones that have caught the attention of ship owners and maritime organizations.

About Author
Raunek Kantharia is a marine engineer turned maritime writer and entrepreneur. After a brief stint at the sea, he founded Marine Insight in 2010. Apart from managing Marine Insight, he also writes for a number of maritime magazines and websites.
Do you have info to share with us ? Suggest a correction
Subscribe To Our Newsletters
By subscribing, you agree to our Privacy Policy and may receive occasional deal communications; you can unsubscribe anytime.


Great Sir….
Hello,
this infographic is great. I was looking for this.
But my question is, which study or research based the graphics and numbers on?
I am interested in this graphic because I am working on a study project about Container Ship emissions this summer.
If you could send me your source, that would be nice of you.