
Infographics : War Vs Piracy at Sea
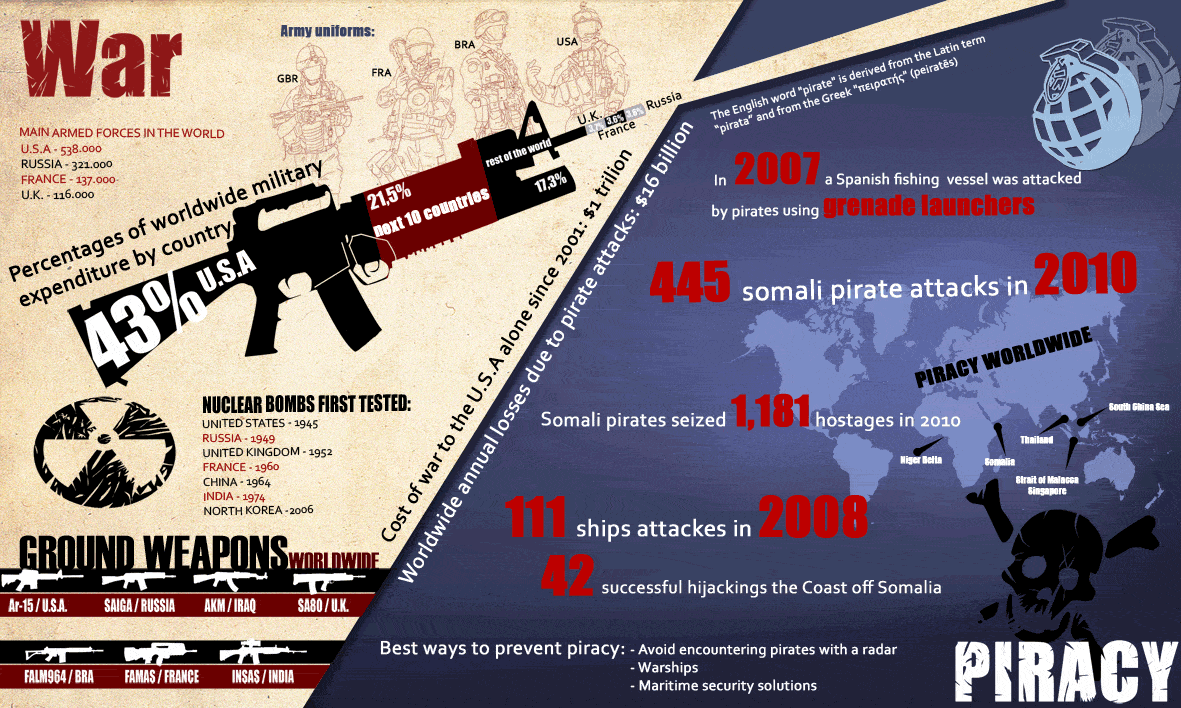
The infographic compares the armed forces of various countries, their uniforms, the amount spent on defense, weapons used and nuclear status versus frequency of pirate attacks, weapons used and human casualties in piracy.
The Infographic has been created by Eder Cebrian for the MSUC.
( Click on the Infographic to enlarge it)
Contact Eder Cebrian – [email protected]
Disclaimer :
The information on this website is for general purposes only. While efforts are made to ensure accuracy, we make no warranties of any kind regarding completeness, reliability, or suitability. Any reliance you place on such information is at your own risk. We are not liable for any loss or damage arising from the use of this website.


Disclaimer :
The information on this website is for general purposes only. While efforts are made to ensure accuracy, we make no warranties of any kind regarding completeness, reliability, or suitability. Any reliance you place on such information is at your own risk. We are not liable for any loss or damage arising from the use of this website.
Related Articles
Subscribe To Our Daily Newsletter
By subscribing, you agree to our Privacy Policy you can unsubscribe anytime.


BE THE FIRST TO COMMENT