

How to Use Main Engine Performance Curve for Economical Fuel Consumption on Ships?
After the building of the ship is complete and before handing over it to the owners, sea trials are done to test that the ship is able to deliver the contractually guaranteed speed. The primary purpose of the sea trial is to determine the speed of the ship with reference to the RPM and the power produced for the same.
Apart from the sea trial of the hull part of the ship, the important machinery of the engine room such as boilers, auxiliary engines and the main engine are also tested. Machineries have a test record apart from the sea trial data, which is done in the manufacturing plant and is called as test bed data. It is normal to have main engine, generators, motors and pumps etc. having these test bed data.
This data pertaining to sea trials/machinery trials, shop trials/ test bed trials and the obtained performance curves enables the Chief Engineer to run the ship safely and economically.
Under the charter party the speed and fuel consumption are fixed among other things. There is little margin for error and if the speed is not enough then there is a speed claim; moreover, if there is over consumption to maintain speed then too there is a fuel claim.
The main engine has to perform satisfactorily and give the rated power at the rated RPM within narrow but allowable limits of temperature and pressure and with correct specific fuel oil consumption.
In addition to all these the lubricating oil and cylinder oil consumption must be kept to minimum to keep the owners happy and the engine maintenance must be up-to-date to match the engine with the performance curves given in the shop trial.
PERFORMANCE CURVES
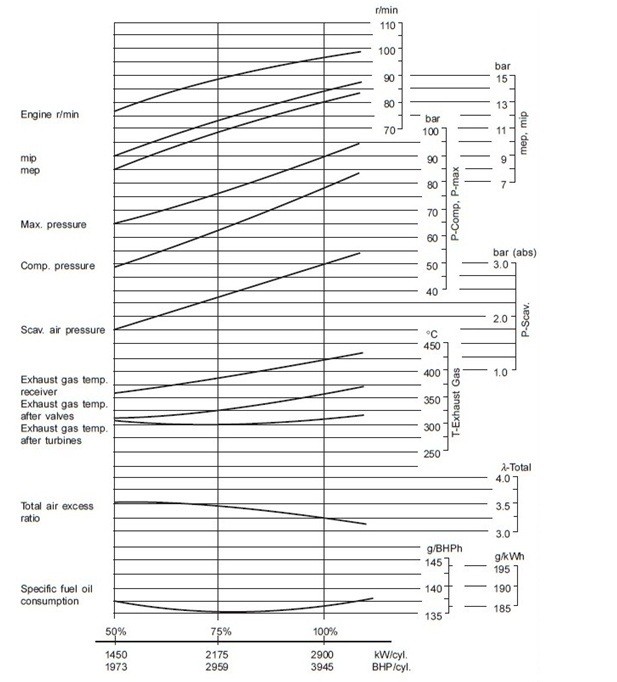
During the test bed or shop trial the performance curves of the engine are plotted. The performance curves are the graphs of different parameters on x-axis plotted against engine power or load on the y-axis. These different plotted curves are as follows:
- Engine RPM vs. Load: This curve helps in ascertaining whether main engine is overloaded or not. A higher power generated at a lower RPM indicates an over loaded main engine.
- Mean effective pressure vs. Load: Mean effective pressure is used to calculate horse power hence these two values should co-relate. In case they don’t then there may be some error in calculation or instrumentation.
- Maximum pressure vs. Load: This curve helps in knowing the condition of fuel injection equipment, injection timing and the compression in the cylinder etc.
- Compression pressure vs. Load: This curve indicates the condition of the parts maintaining compression like piston, piston rings and exhaust valves.
- Scavenge air pressure vs. Load: It indicates the condition of the turbocharger and associated equipment.
- Exhaust gas temperature in receiver vs. Load: It indicates the enthalpy of the exhaust gas prior to entry in turbocharger. This value compared with the value after the turbocharger gives the temperature drop across the turbocharger, is an indicator of turbocharger efficiency.
- Exhaust gas temperature after exhaust valve vs. Load: This curve sheds light on the combustion, fuel injection, timing and compression etc. A higher temperature may be caused due to after burning.
- Exhaust gas temperature after turbocharger vs. Load: This curve is very useful as it indicates the enthalpy captured from the exhaust by the turbocharger and hence its condition. In case the receiver temperature is within range but the outlet temperature is higher it may indicate fouling of the turbocharger and hence the associated lower scavenge air pressure and high exhaust gas temperature.
- Total excess air ratio vs. Load: This curve is scarcely used by ship staff and is useful for design engineers. This curve sheds light on scavenging and the turbocharger capacity and condition. It shows that as the power increases the excess air decreases due to consumption.
- Specific fuel oil consumption vs. Load: This curve helps to counter check whether the engine is consuming fuel oil correctly as per the load.
There may be other parameters listed as per manufacturer. A typical performance curve for a slow speed two stroke marine diesel engine is given below.
Economical Fuel Consumption
The main engine will run economically if the engine is well maintained and is run at the rated economic rating where the Specific Fuel Oil Consumption is the least. An engine is said to be performing well or well maintained if it can be safely run at the rated RPM at the rated load. For example if an engine is having a continuous service rating of 15000 BHP at 104 RPM but cannot reach the rated RPM and is developing 15000 BHP prematurely at 98 RPM, there is a loss of ship’s speed and a subsequent speed claim. It also tells that there is a problem, the ship cannot give speed, it is over consuming fuel and that the engine is over loaded. It points to either hull fouling, damaged propeller or faulty prime mover etc.
In such cases the careful study of the sea trial data, engine shop trial data and the performance curves will help to determine the cause of the problem.
For trouble shooting first the main engine performance must be taken on a good weather day when the engine load is steady. The main engine must be run to its rated power. Thereafter the data found must be super imposed on the performance curves.
After superimposing the measured parameters on the performance curves, we come to know whether the parameters are normal or abnormal. A complete study of the parameters helps us to pin point the problem. An example of the performance data superimposed on the performance curve is given below.
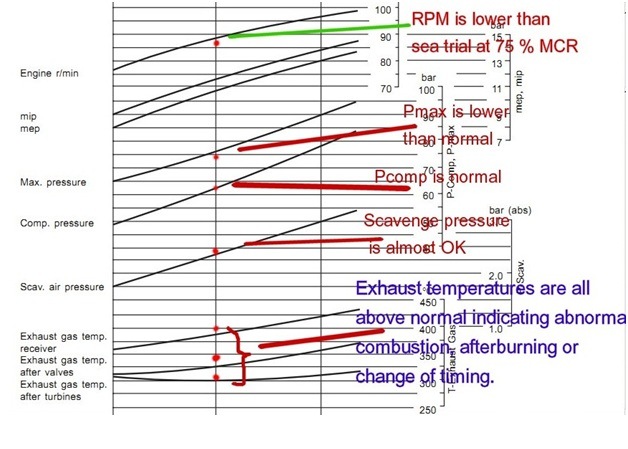
From above diagram the following points are inferred:
- At 75% MCR the RPM attained is lower that the sea trial.
- The average maximum cylinder pressure P max is lower than the sea trial.
- The compression pressure P comp is almost same as sea trial confirming that the running gear like piston, piston rings and exhaust valves are ok.
- The scavenge pressure is almost normal suggesting that the turbocharger is in satisfactory condition and the enthalpy of the exhaust gas is higher than normal for this RPM.
- Exhaust temperatures are all increased suggesting abnormal combustion, after burning or change of timing. It may also indicate faulty fuel injection equipment.
The above example will help to understand the use of performance curves for a ship’s engineer. After the main engine performance has been taken and plotted on the original performance curves from the sea trial data, the problem can be found out and SFOC restored to normal values. In this way at any stage during the life time of the ship, we can understand why she is not performing based on plotting her parameters on the performance curves.
References
- Pounder’s Marine Diesel Engines and Gas Turbines
- Authors experience as a sea going Chief Engineer.
Do you have info to share with us ? Suggest a correction

About Author
Chief Engineer Mohit Sanguri is a Marine Chief Engineer (Class I Unlimited Power). He has 12+ years of experience as a Marine Engineer.

Subscribe To Our Newsletters
By subscribing, you agree to our Privacy Policy and may receive occasional deal communications; you can unsubscribe anytime.
how MEP effects NOX emission of a ship
Dear Sir,
Your blog on performance curve was good and a different perspective for ME performance analysis.Do you have and blog on dry dock works and checks.
Hi Vikram, we have a ebooks for that. Kindly check >> https://www.marineinsight.com/guides
Good Day Dears! There is proposal to exchange information about faults and troubleshooting for RT Flex Engines.
With BRGDS Igor
Dear chief engineer mohit,
i appreciate your writings on economical fuel consumption, it very interesting. but please can you tell me more about fuel oil transfer on board vessels and its principle of operation.
How propeller curves are of use for a chief engineer?
Sir can I ask how I will calculate estimated power by means of turbocharger rpm our engine is wartsila rtflex 58 many thanks for your usefull advise.
Why nox regulatios are only for engines more than 130 kw not less than that
Hi,
When we compare block loading withstand capability of two different Diesel engines – what are the things we should look at ? Many thanks. Best Regards.
Sir please explain me what is the difference between MIP and MEP shown in the performance curve? And how they are affecting the performance of the engine?
Sir charter party topic is not opening.
Please help
@Sudeep: MIP, Mean Indicated Pressure, is the mean of the pressures recorded on the indicator diagram, calculated using a planimeter or electronically. Inputting this Pressure value into the PLAN formuala will enable you to calculat the Indicated Power.
MEP, Mean Effective Pressure is calculated backwards from the measured Brake power using the PLAN formuala. Where P is the pressure, L is length of stroke, A is area and N is Number of power strokes.
The Indicated Power and Pressure will always be greater than the MEP and Brake Power because of friction in the engine.
The above info is suffucient for finding the inter relation ship between various parameters of engine. Speed and fuel cons of charter party are valid only upto bf scale 5 weather.
Best way to get best fuel efficiency and safe engine operation is following the propeller curve ( load diagram) and ensure propeller is not overloaded due to any reason
If the reason is not due to weather and hull fouling , the reason to be investigated and rectified.
how can I determine the start-up cost for a diesel generator?
I want to know about propeller load and curve, and how it can be use with engine performance