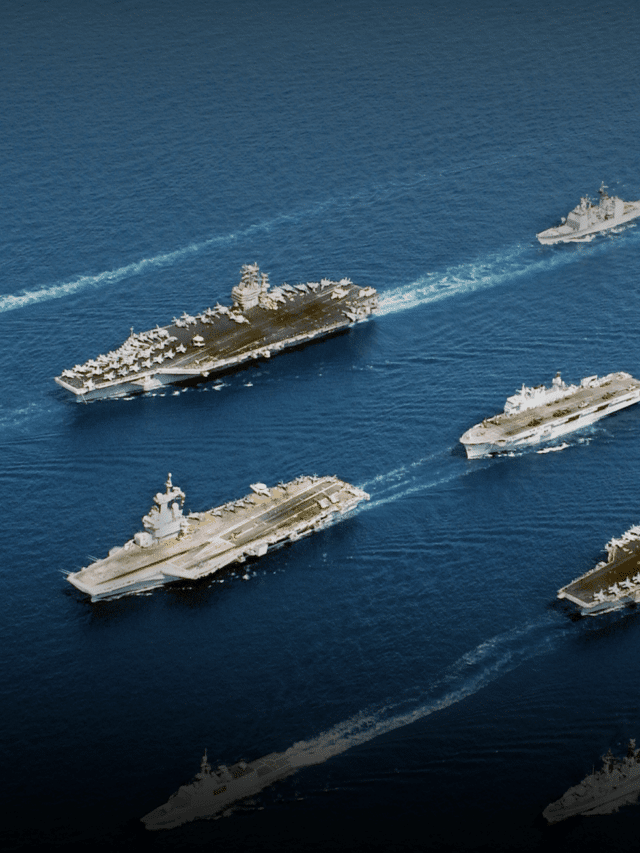
Infographics : War Vs Piracy at Sea
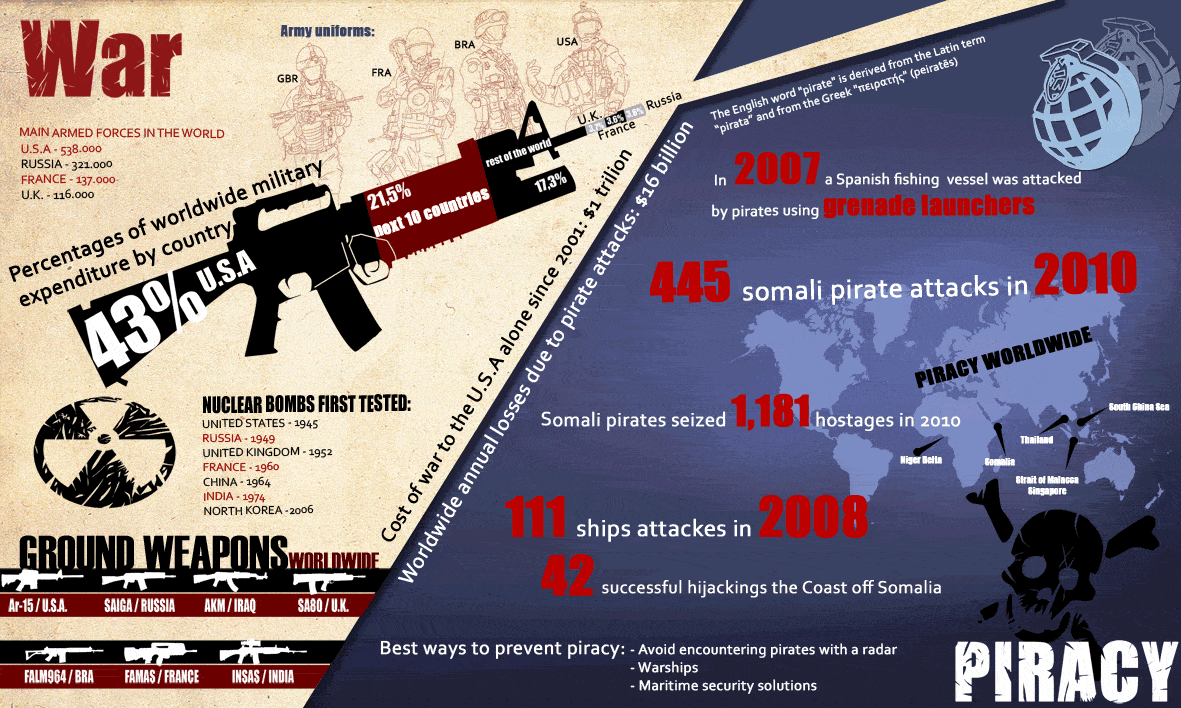
The infographic compares the armed forces of various countries, their uniforms, the amount spent on defense, weapons used and nuclear status versus frequency of pirate attacks, weapons used and human casualties in piracy.
The Infographic has been created by Eder Cebrian for the MSUC.
( Click on the Infographic to enlarge it)
Contact Eder Cebrian – e.cebrian@accuracast.com
Do you have info to share with us ? Suggest a correction
About Author
Marine Insight News Network is a premier source for up-to-date, comprehensive, and insightful coverage of the maritime industry. Dedicated to offering the latest news, trends, and analyses in shipping, marine technology, regulations, and global maritime affairs, Marine Insight News Network prides itself on delivering accurate, engaging, and relevant information.
Subscribe To Our Newsletters
By subscribing, you agree to our Privacy Policy and may receive occasional deal communications; you can unsubscribe anytime.
Web Stories


